Let's get accuracy vs precision straight
TLDR: The terms precision and accuracy should not be used interchangeably, as it is possible to be precisely wrong or roughly right.
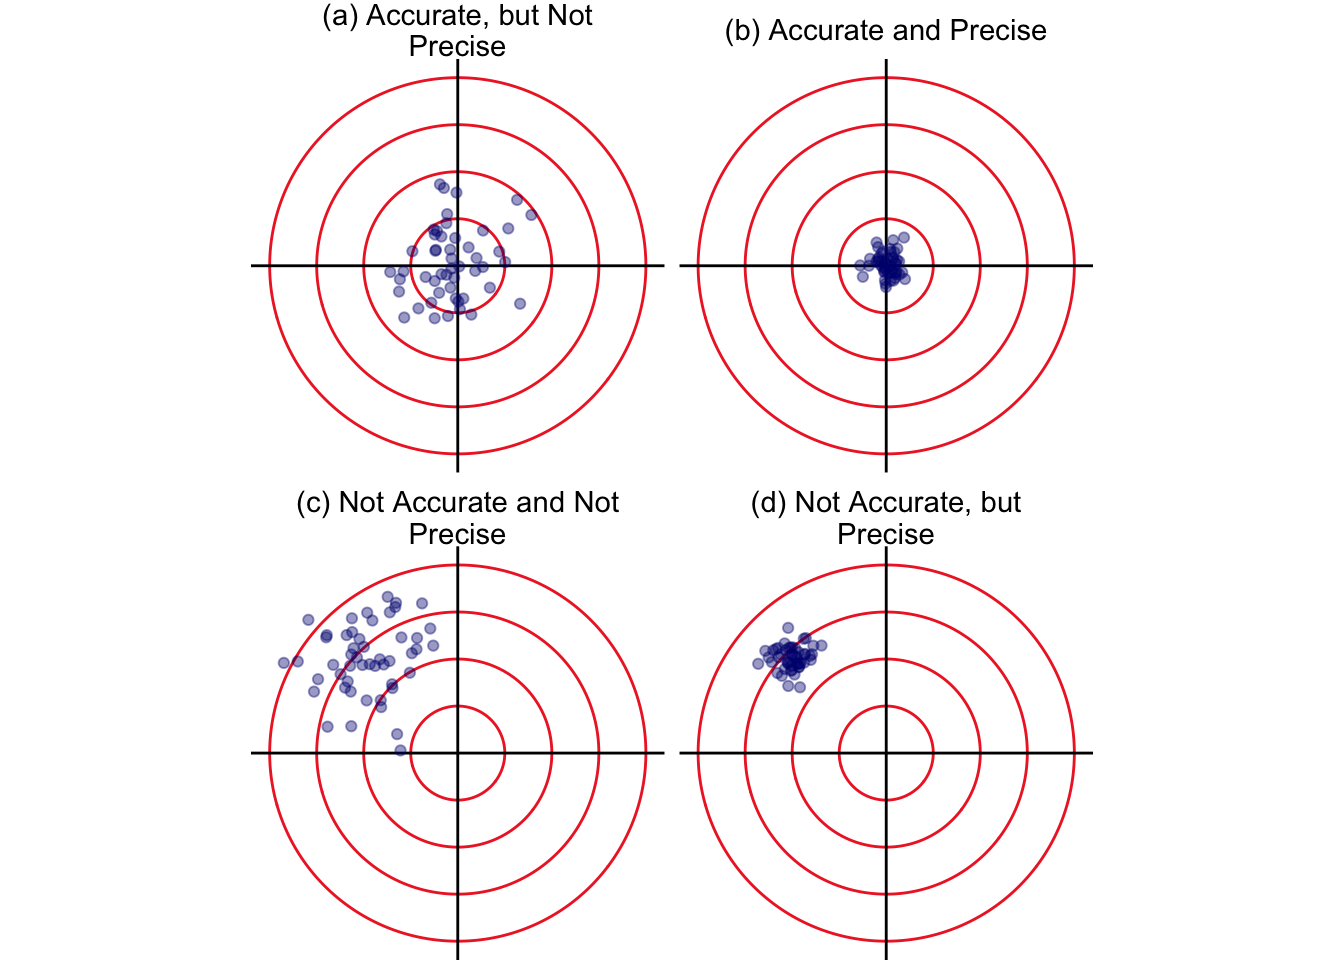
Not precise, but accurate is also known as roughly right - Figure (a).
Not accurate, but precise is also known as precisely wrong - Figure (d).
Being accurate means your estimates or measurements are close to ground truth. Determining accuracy can only be done via validation or calibration. Sometimes people mistake precision for accuracy, however it is possible to be precise, while not being accurate. For example, measurements can look precise when they have a lot of decimal places, e.g., 1.48261. Sometimes these decimal places are an artifact of statistics and should not be reported. Other times the same faulty measurement is repeated over and over, without calibration. Either way, I hope these plots help clarify these two terms.
library(tidyverse)
library(ggforce)

circledata = tibble(x0 = 0, y0 = 0, r = 1:4)

set.seed(1)
acc_prec       = tibble(type = "(b) Accurate and Precise",          x = rnorm(50,  0, 0.25), y = rnorm(50, 0, 0.25))
acc_notprec    = tibble(type = "(a) Accurate, but Not Precise",     x = rnorm(50,  0, 0.75), y = rnorm(50, 0, 0.75))
notacc_prec    = tibble(type = "(d) Not Accurate, but Precise",     x = rnorm(50, -2, 0.25), y = rnorm(50, 2, 0.25))
notacc_notprec = tibble(type = "(c) Not Accurate and Not Precise",  x = rnorm(50, -2, 0.75), y = rnorm(50, 2, 0.75))

exampledata = bind_rows(acc_prec, acc_notprec, notacc_prec, notacc_notprec)

exampledata %>%
  ggplot() +
  geom_circle(data = circledata, aes(x0 = x0, y0 = y0, r = r), colour = "firebrick2") +
  geom_hline(yintercept = 0) +
  geom_vline(xintercept = 0) +
  geom_point(aes(x = x, y = y), alpha = 0.4, colour = "navyblue") +
  facet_wrap(~type, labeller = label_wrap_gen(width = 25)) +
  theme_void() +
  theme(aspect.ratio = 1,
        strip.text = element_text(size = 11))