
Get data from ggplot()
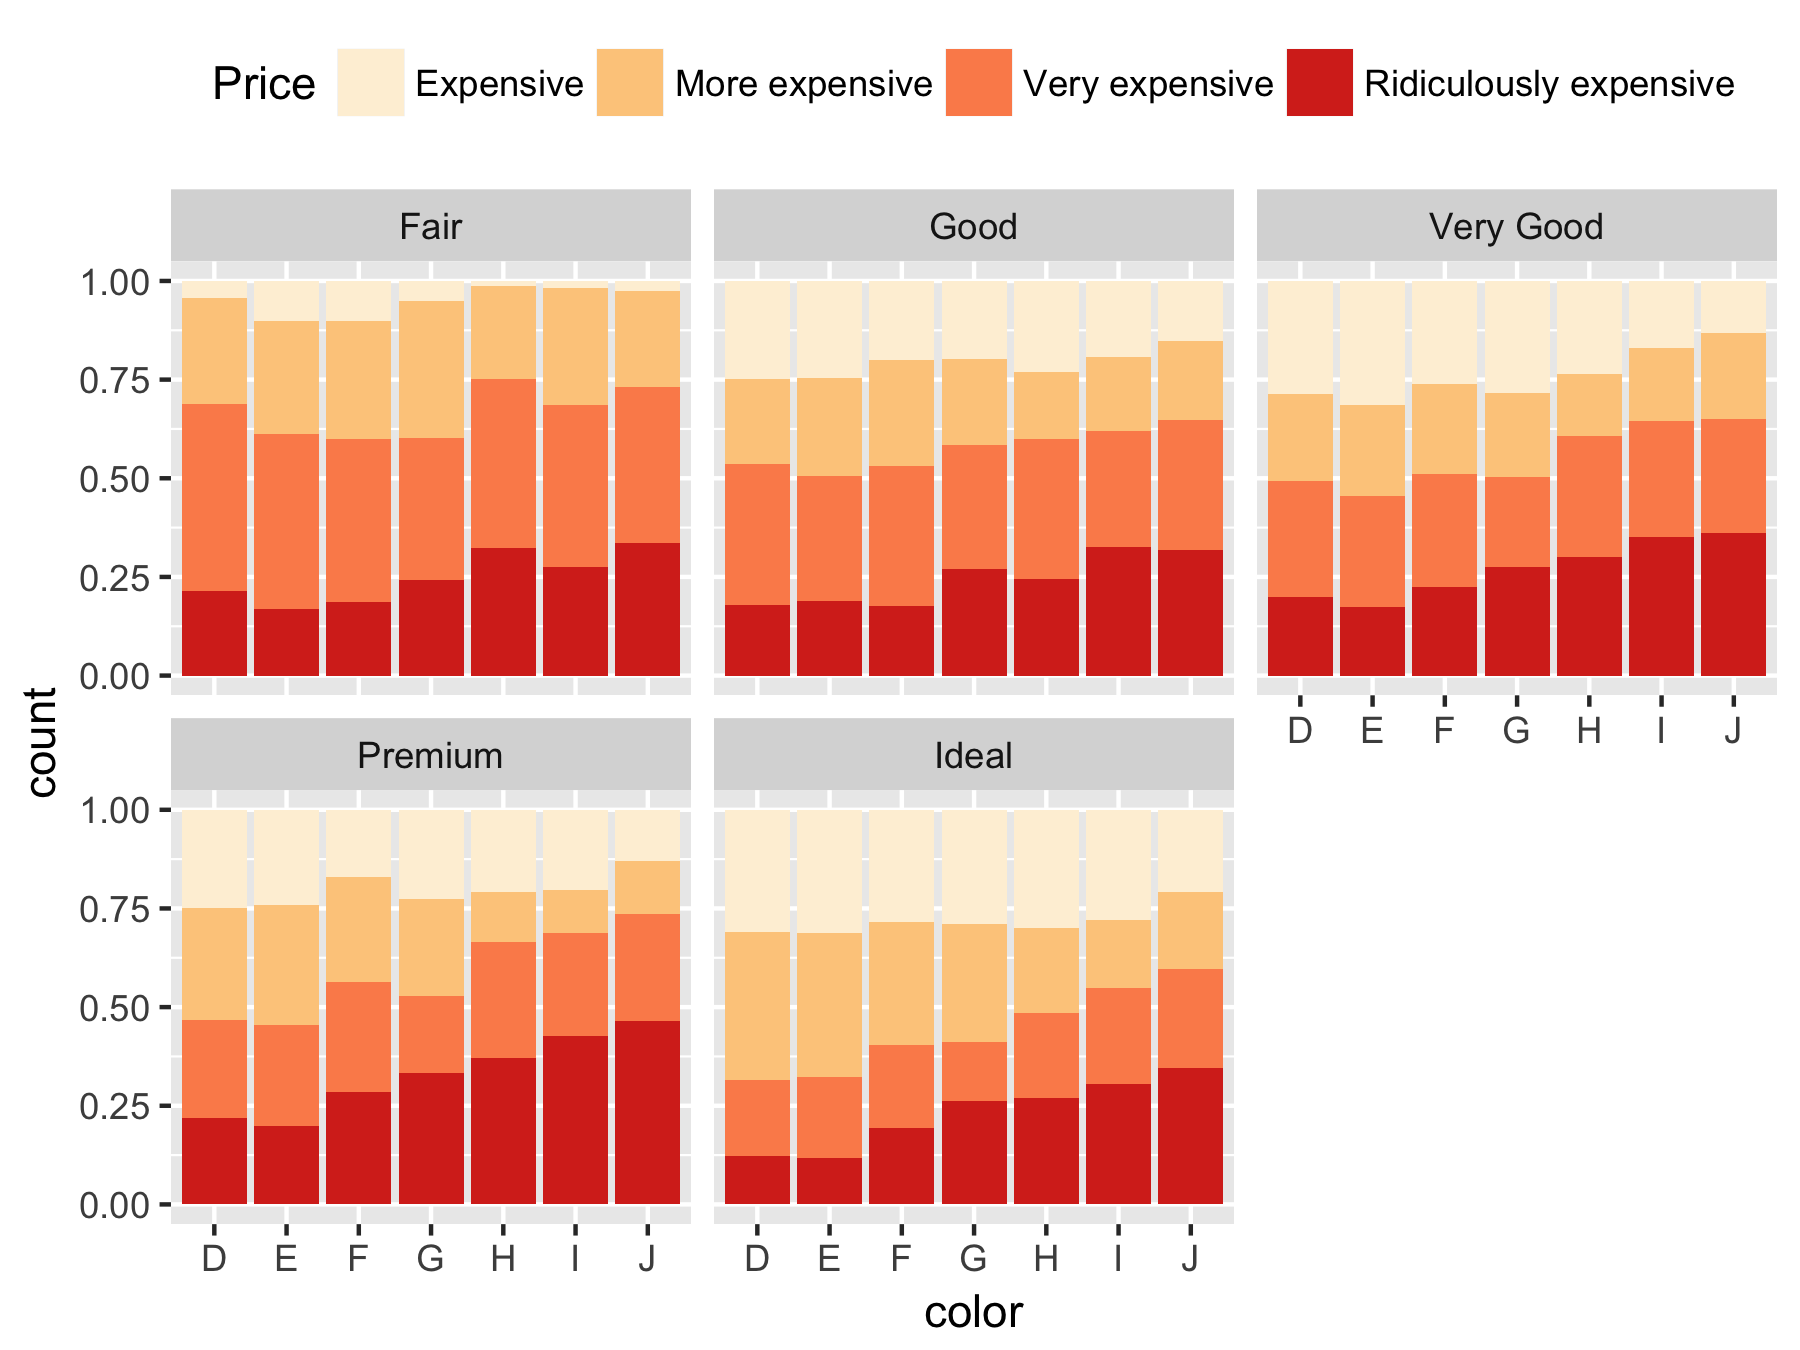
ggplot includes built in and seamless functionality that summarises your data before plotting it. As shown in the example below, ggplot_build() can be used to access the summarised dataset.
fill         y count prop x PANEL group    ...
#D7301F 0.2147239    35    1 1     1     4 ...
#FC8D59 0.6871166    77    1 1     1     3 ...
#FDCC8A 0.9570552    44    1 1     1     2 ...
#FEF0D9 1.0000000     7    1 1     1     1 ...
#D7301F 0.1696429    38    1 2     1     8 ...
#FC8D59 0.6116071    99    1 2     1     7 ...
...
