
Global map of country names
This post demonstrates the use of two very cool R packages - ggrepel and patchwork.
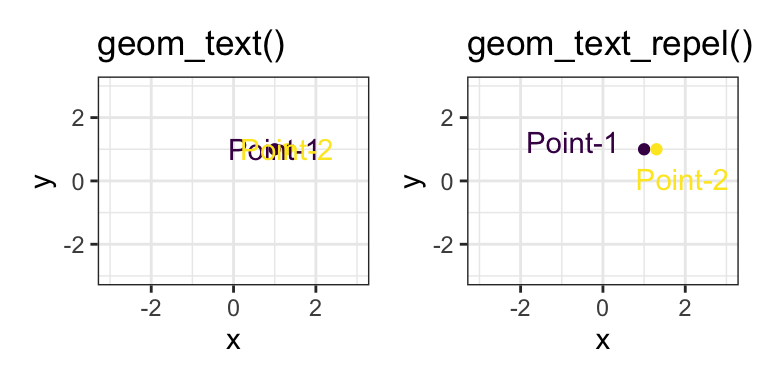
ggrepel deals with overlapping text labels (Code#1 at the bottom of this post):
patchwork is a very convenient new package for combining multiple different plots together (i.e. what we usually to use grid and gridExtra for).
More info:
To really demonstrate the power of them, let’s make a global map of country names using ggrepel:
library(tidyverse)
library(ggrepel)
library(patchwork)

# data from https://worldmap.harvard.edu/data/geonode:country_centroids_az8

orig_data = read_csv("country_centroids_az8.csv")


centroidsdata = orig_data %>%
  select(country = admin, continent, lat = Latitude, lon = Longitude) %>%
  filter(continent != "Seven seas (open ocean)" & continent != "Antarctica") %>%
  mutate(continent  = fct_collapse(continent, "Americas" = c("North America", "South America")))

head(centroidsdata)
## # A tibble: 6 × 4
## country continent lat lon
## <chr> <fct> <dbl> <dbl>
## 1 Aruba Americas 12.5 -70.0
## 2 Afghanistan Asia 33.8 66.0
## 3 Angola Africa -12.3 17.5
## 4 Anguilla Americas 18.2 -63.1
## 5 Albania Europe 41.1 20.0
## 6 Aland Europe 60.2 20.0plot1 = centroidsdata %>%
ggplot(aes(x = lon, y = lat, label = country, colour = continent)) +
geom_text_repel(segment.alpha = 0) +
theme_void() +
scale_color_brewer(palette = "Dark2")
plot1## Warning: ggrepel: 24 unlabeled data points (too many
## overlaps). Consider increasing max.overlaps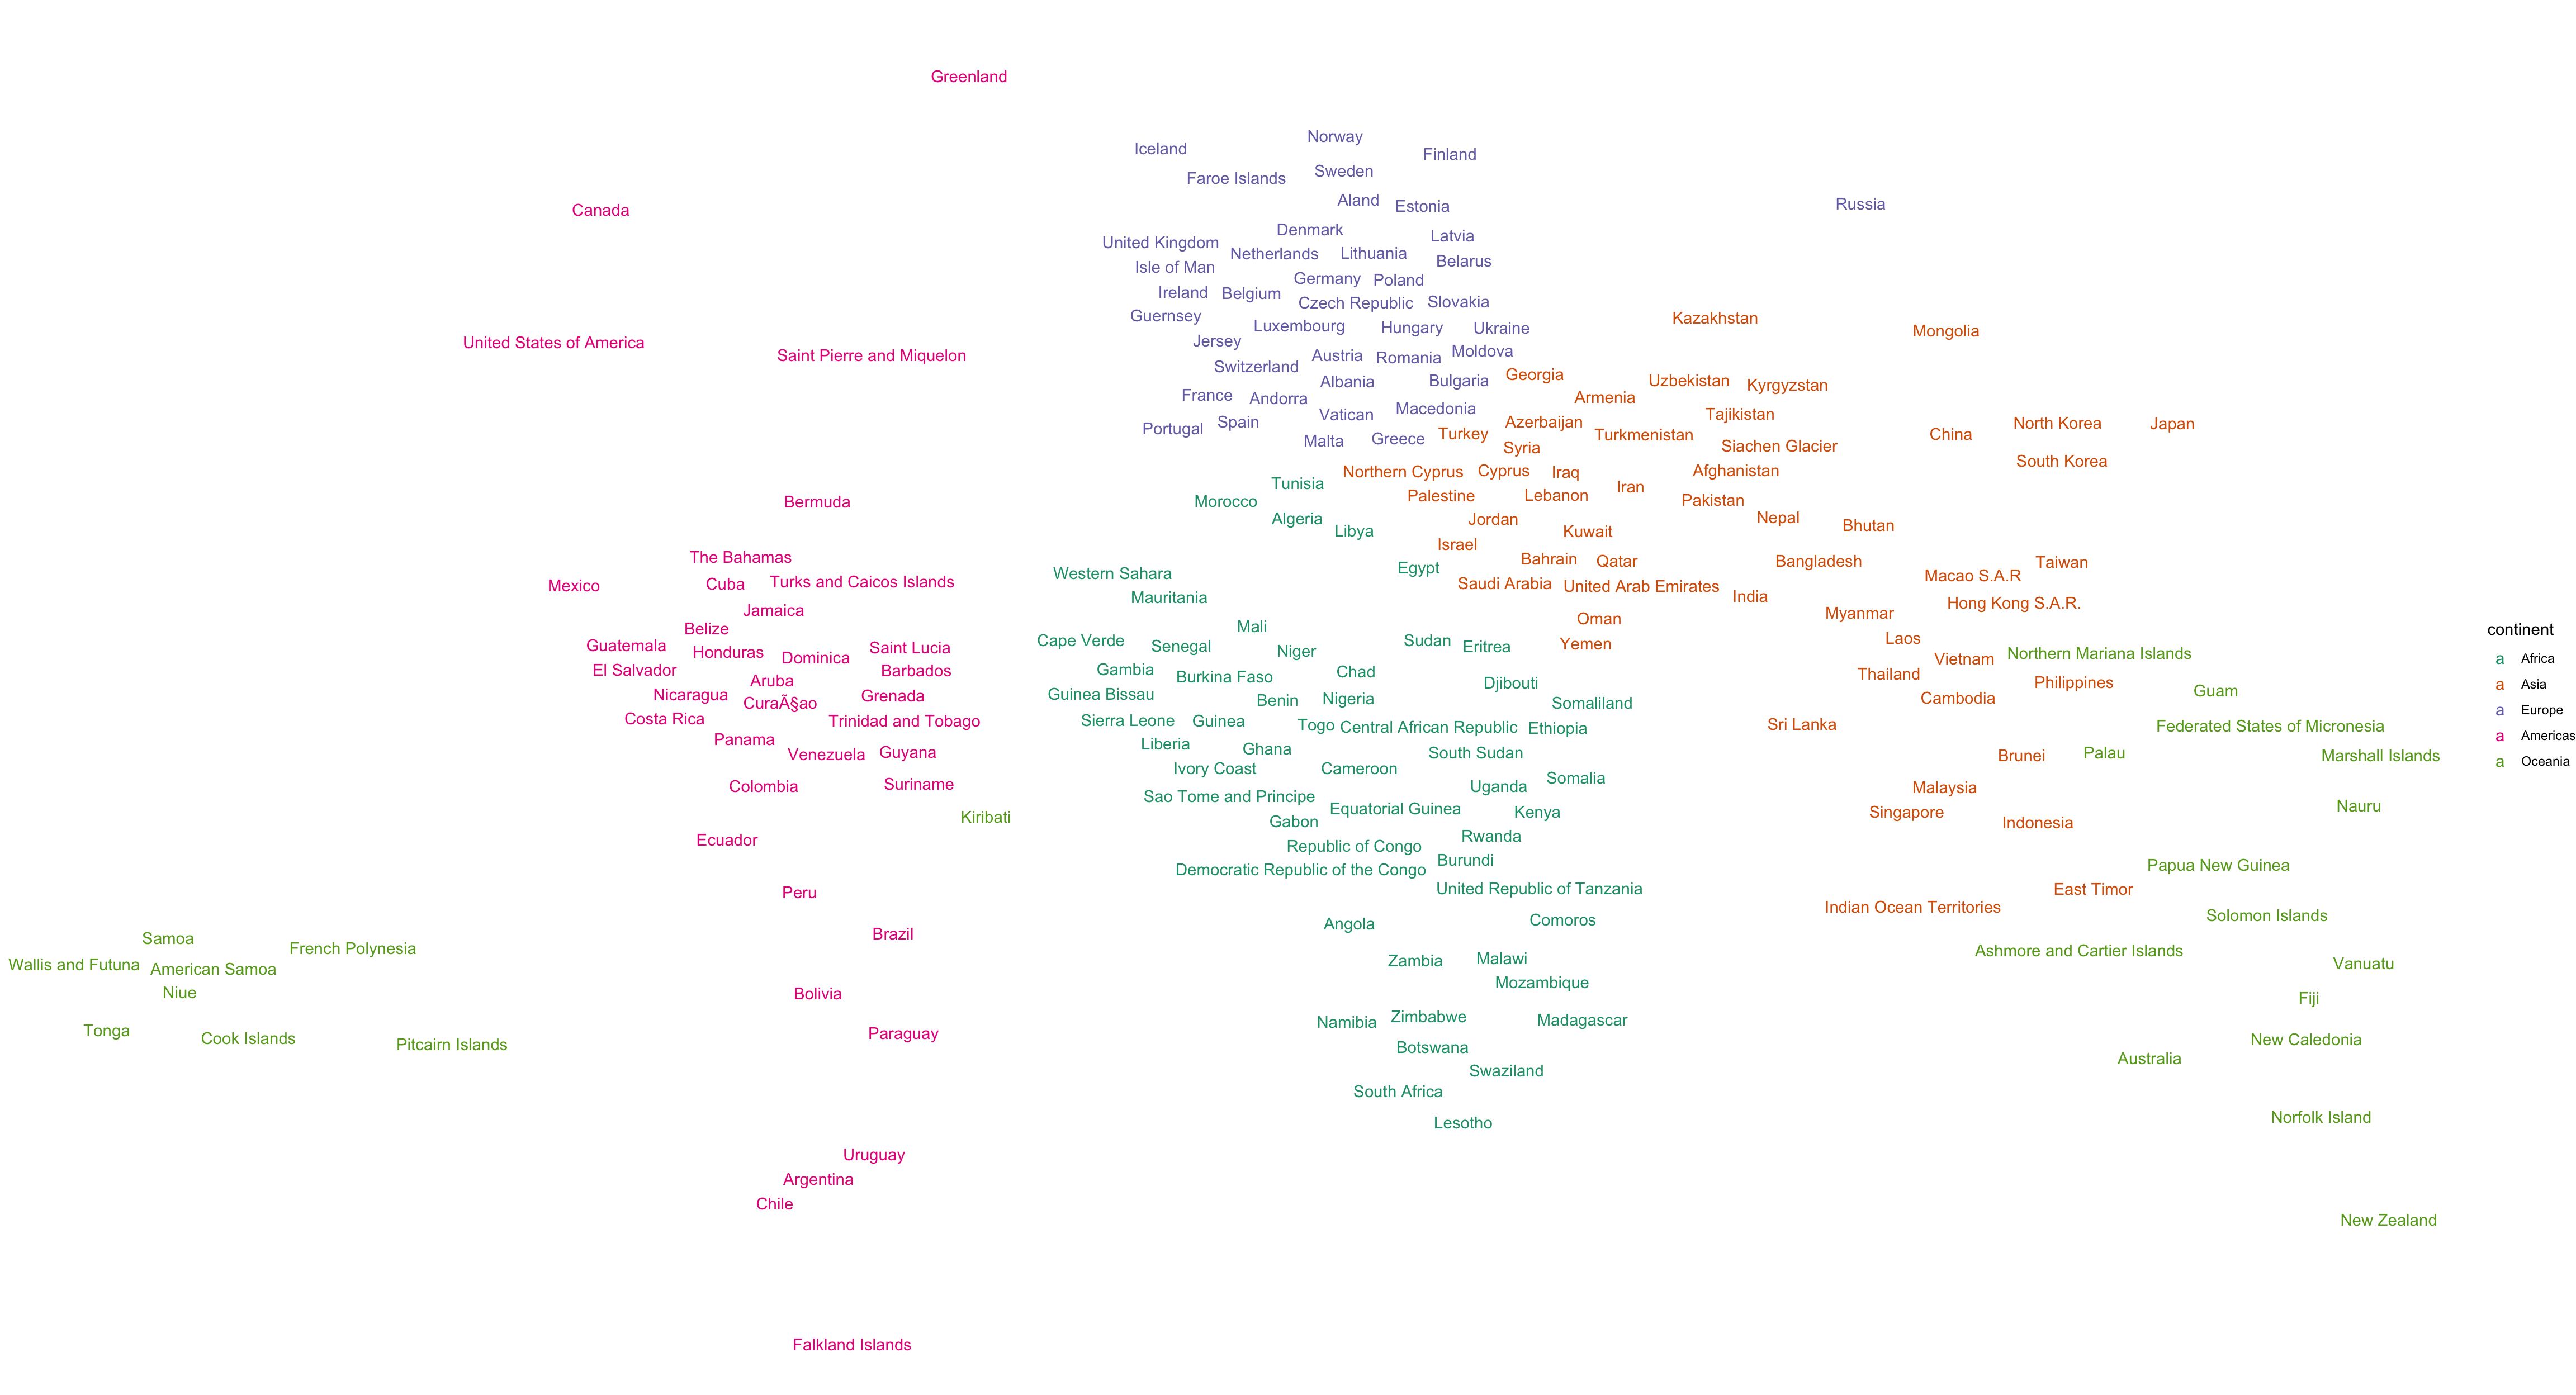
Now this is very good already with hardly any overlapping labels and the world is pretty recognisable. And really, you can make this plot with just 2 lines of code:
ggplot(centroidsdata, aes(x = lon, y = lat, label = country)) +
geom_text_repel(segment.alpha = 0)
So what these two lines make is already very amazing.
But I feel like Europe is a little bit misshapen and that the Caribbean and Africa are too close together. So I divided the world into regions (in this case same as continents except Russia is it’s own region - it’s just so big). Then wrote two functions that asked ggrepel to plot each region separately and use patchwork to patch each region together:
centroidsdata = centroidsdata %>%
  mutate(region = continent %>% fct_expand("Russia")) %>%
  mutate(region = replace(region, country == "Russia", "Russia"))

mapbounds = centroidsdata %>%
  group_by(region) %>%
  summarise(xmin = min(lon), xmax = max(lon), ymin = min(lat), ymax = max(lat))


create_labelmap = function(mydata, mycontinent, myforce = 1, mycolour = "black"){

  mymapbounds = mapbounds %>%
    filter(region == mycontinent)

  mydata %>%
    filter(region == mycontinent) %>%
    ggplot(aes(x = lon, y = lat, label = country)) +
    geom_text_repel(segment.alpha = 0, force = myforce, colour = mycolour)   +
    theme_void() +
    theme(legend.position = "none") +
    scale_y_continuous(limits = c(mymapbounds$ymin, mymapbounds$ymax)) +
    scale_x_continuous(limits = c(mymapbounds$xmin, mymapbounds$xmax))

}

mycolours = RColorBrewer::brewer.pal(5,"Dark2")

make_world = function(mydata){
  mydata  = centroidsdata
  afr = create_labelmap(mydata, "Africa",   mycolour = mycolours[1])
  ame = create_labelmap(mydata, "Americas", mycolour = mycolours[4])
  asi = create_labelmap(mydata, "Asia",     mycolour = mycolours[2])
  eur = create_labelmap(mydata, "Europe",   mycolour = mycolours[3])
  rus = create_labelmap(mydata, "Russia",   mycolour = mycolours[3])
  oce = create_labelmap(mydata, "Oceania",  mycolour = mycolours[5])


  (ame + (eur / afr) + (rus / asi / oce)) + plot_layout(ncol = 3)
}

plot2 = make_world(centroidsdata)

plot2
## Warning: ggrepel: 12 unlabeled data points (too many
## overlaps). Consider increasing max.overlaps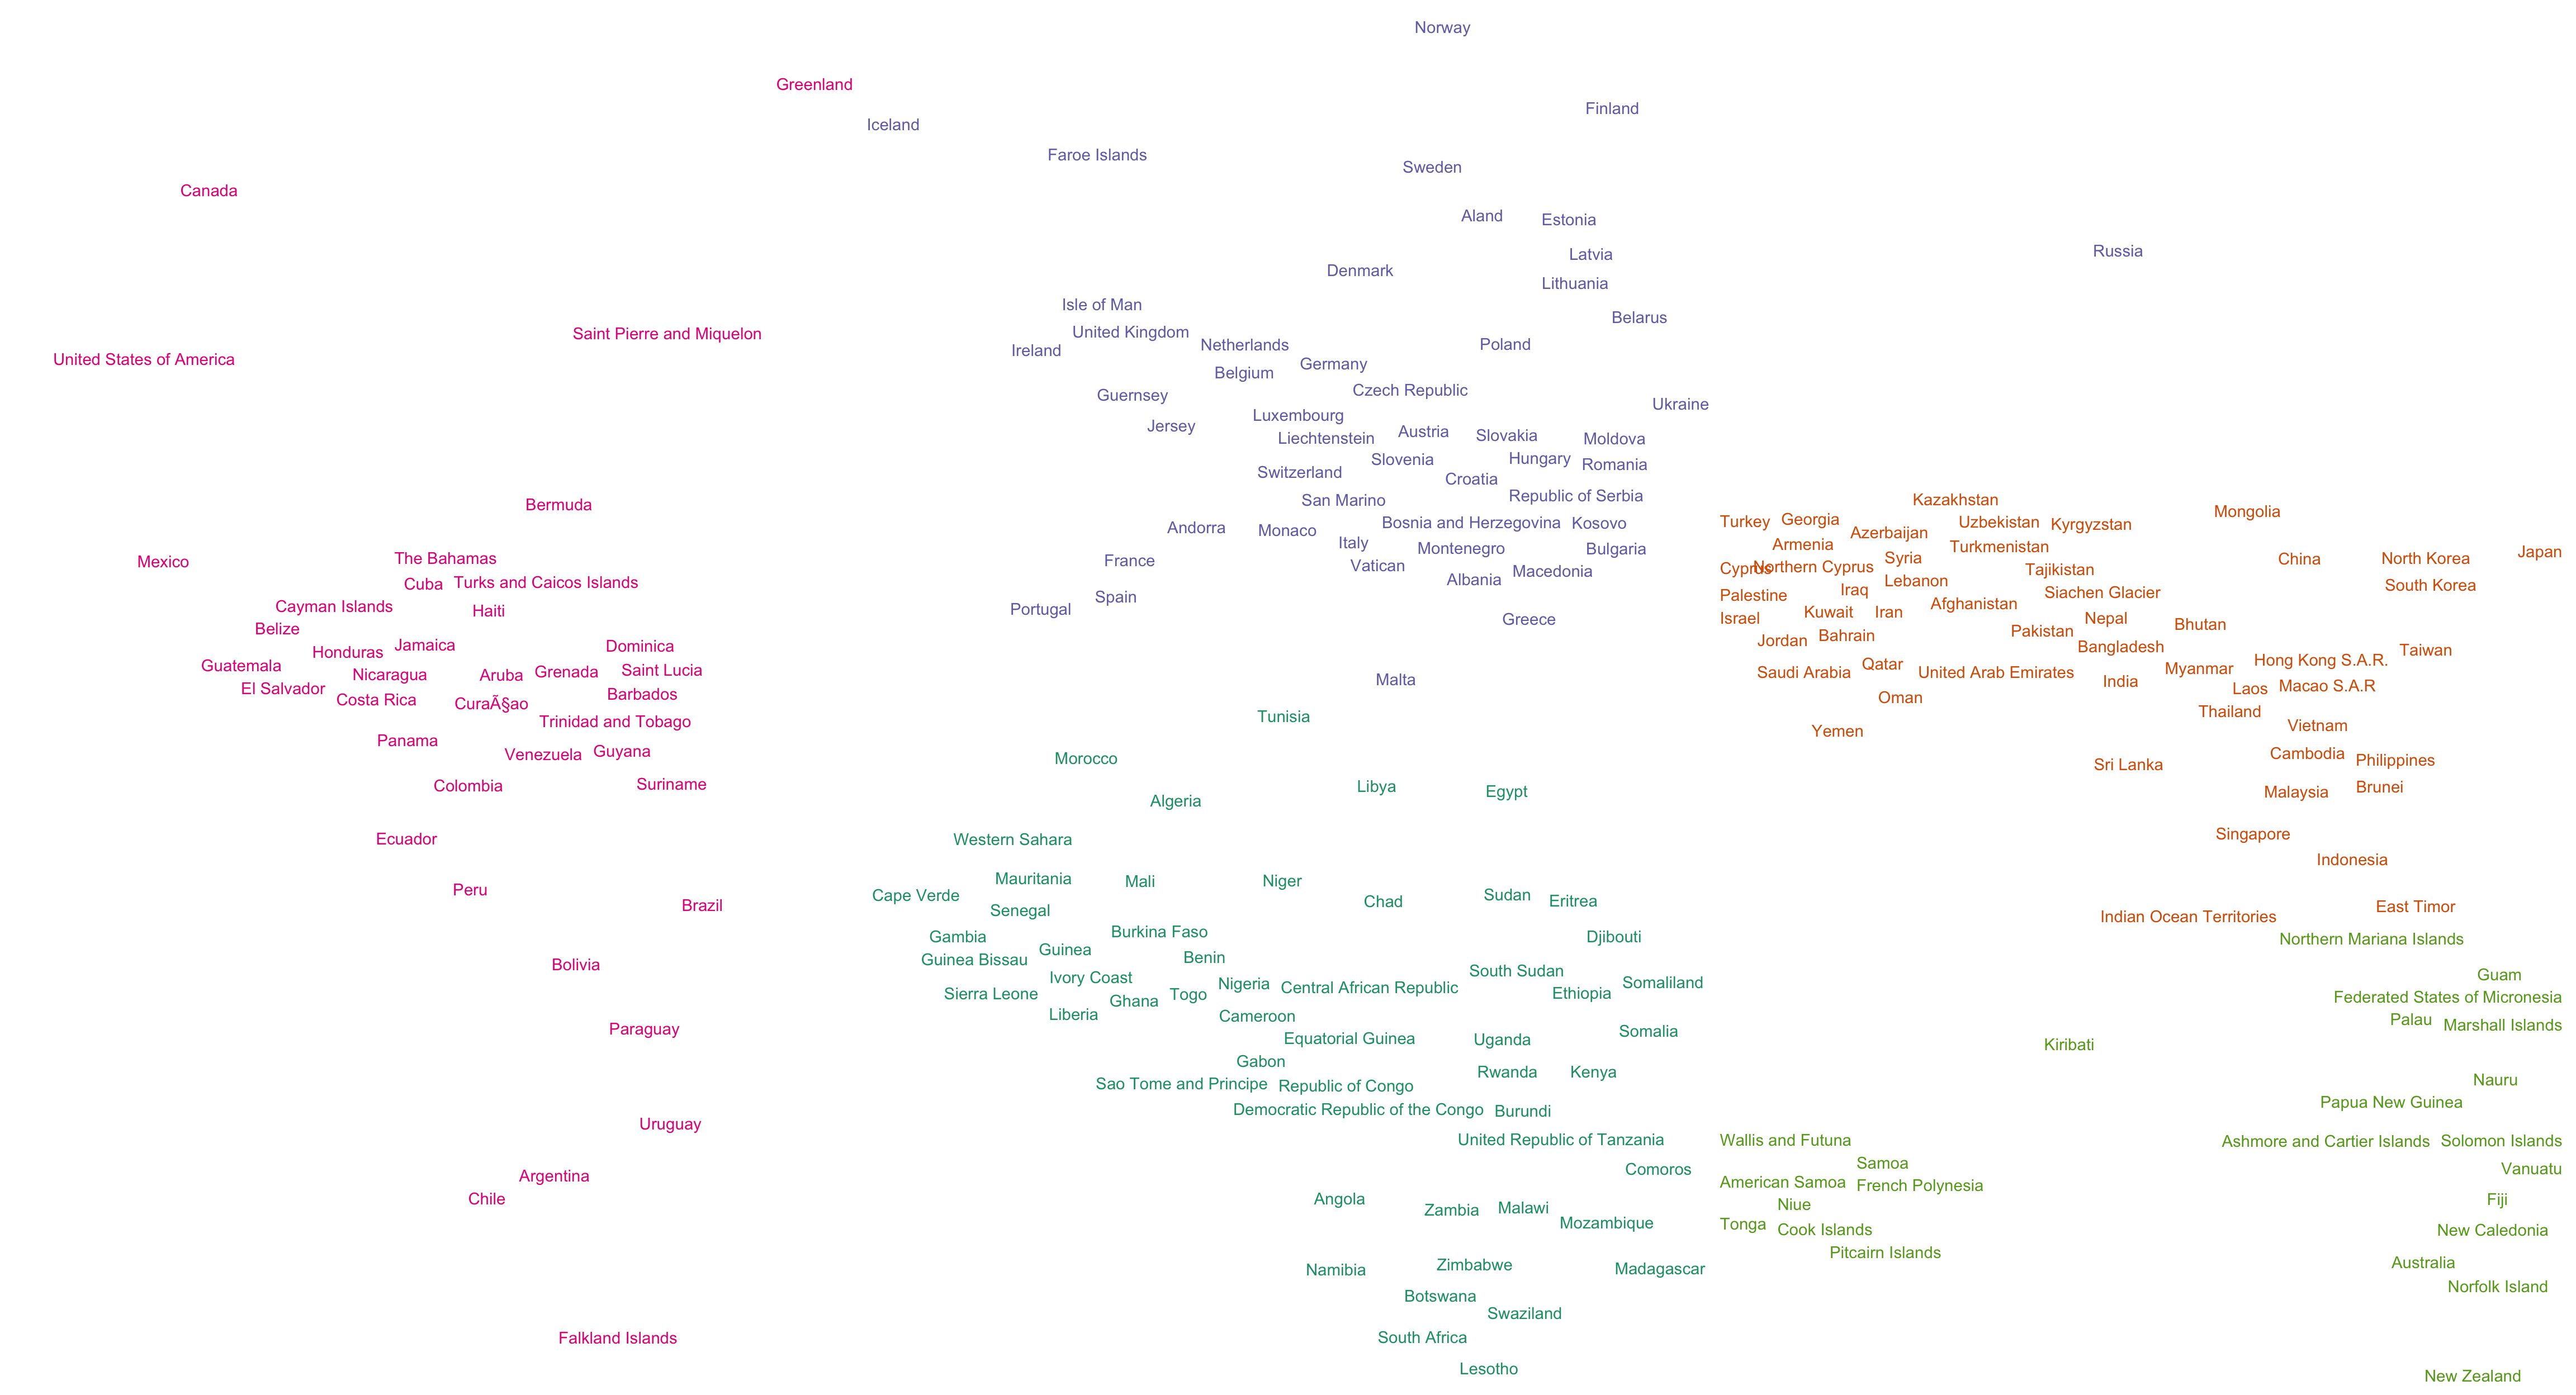
This gives continents a much better shape, but it does severaly misplace Polynesia. See if you can find where, e.g., Tonga is and where it should be.
To see what I did with patchwork there, let’s add black borders to each region (Code#2):
## Warning: ggrepel: 12 unlabeled data points (too many
## overlaps). Consider increasing max.overlaps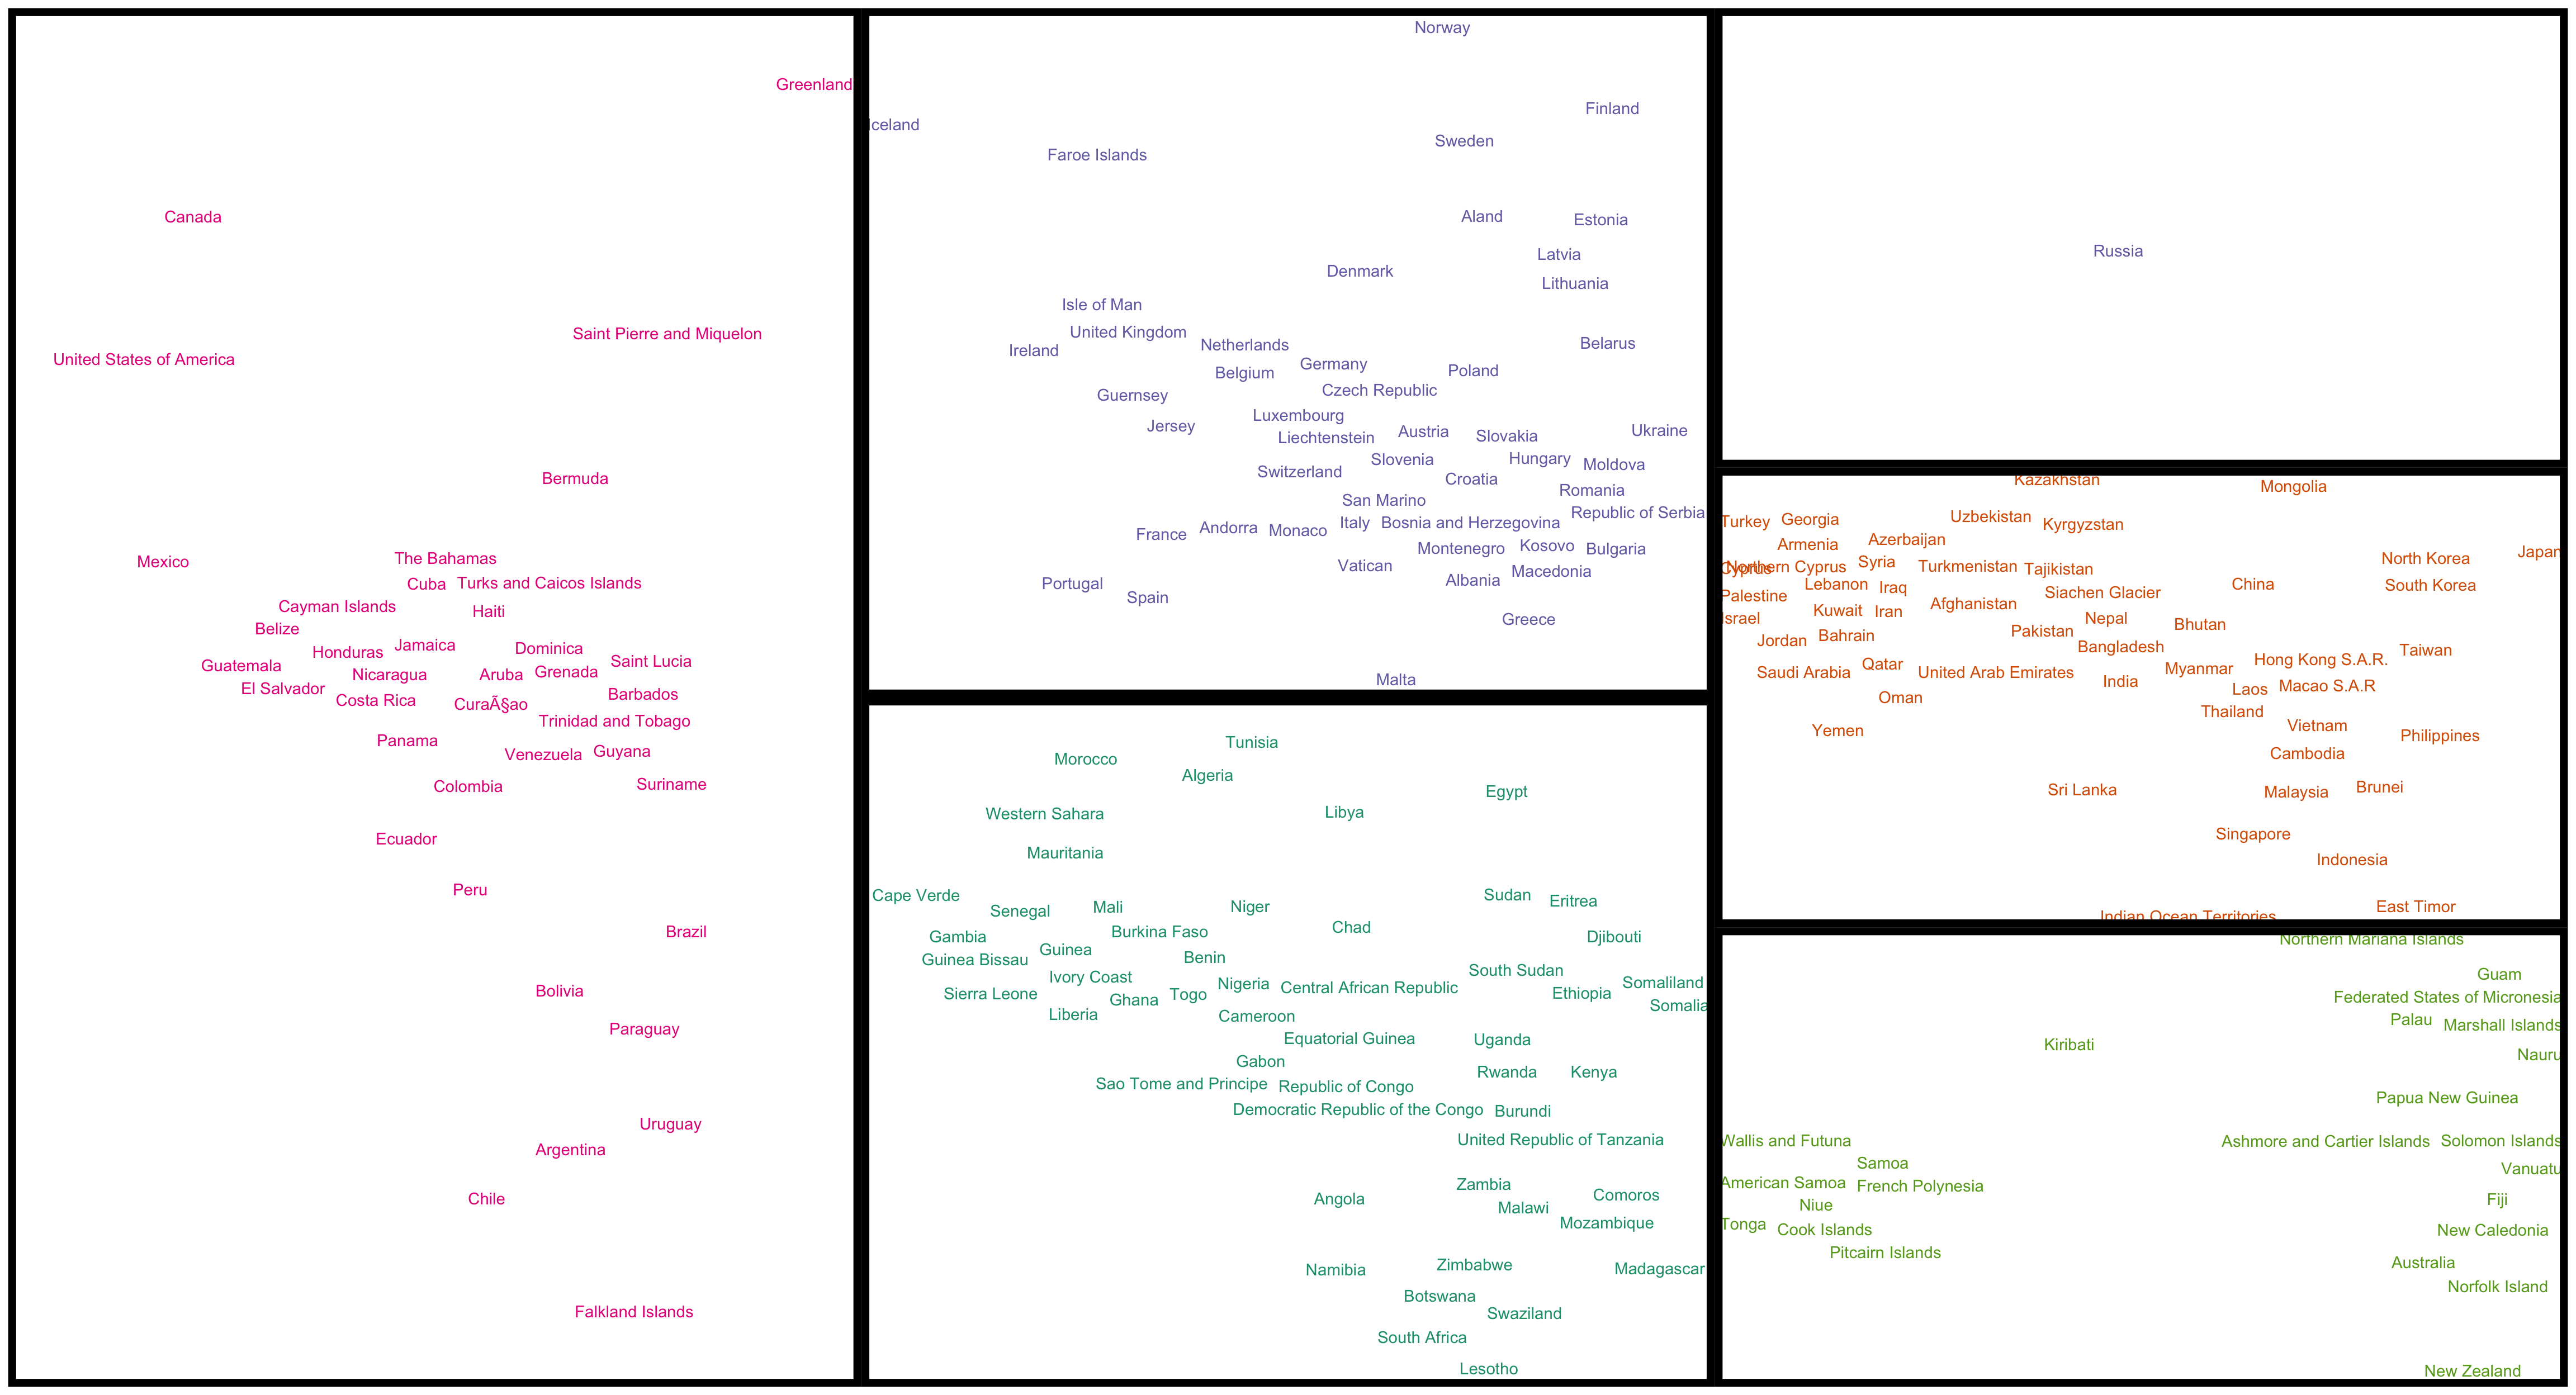
Code#1:
#devtools::install_github("slowkow/ggrepel")
#devtools::install_github("thomasp85/patchwork")


library(tidyverse)
library(ggrepel)
library(patchwork)

mydata  = data_frame(x = c(1, 1.3), y = c(1, 1), mylabel = c("Point-1", "Point-2"))

p = mydata %>%
  ggplot(aes(x, y, label = mylabel, colour = mylabel)) +
  geom_point() +
  coord_cartesian(xlim = c(-3, 3), ylim = c(-3, 3)) +
  theme_bw() +
  theme(legend.position = "none") +
  scale_colour_viridis_d()

plot1 = p + geom_text() + ggtitle("geom_text()")

plot2 = p+ geom_text_repel() + ggtitle("geom_text_repel()")

plot1 + plot2
Code#2:
create_labelmap = function(mydata, mycontinent, myforce = 1, mycolour = "black"){

  mymapbounds = mapbounds %>%
    filter(region == mycontinent)

  mydata %>%
    filter(region == mycontinent) %>%
    ggplot(aes(x = lon, y = lat, label = country)) +
    geom_text_repel(segment.alpha = 0, force = myforce, colour = mycolour)   +
    theme_void() +
    theme(legend.position = "none") +
    scale_y_continuous(limits = c(mymapbounds$ymin, mymapbounds$ymax)) +
    scale_x_continuous(limits = c(mymapbounds$xmin, mymapbounds$xmax)) +
    theme(panel.border = element_rect(colour = "black", fill=NA, size=5))

}

plot3 = make_world(centroidsdata)

plot3