Your first Shiny app

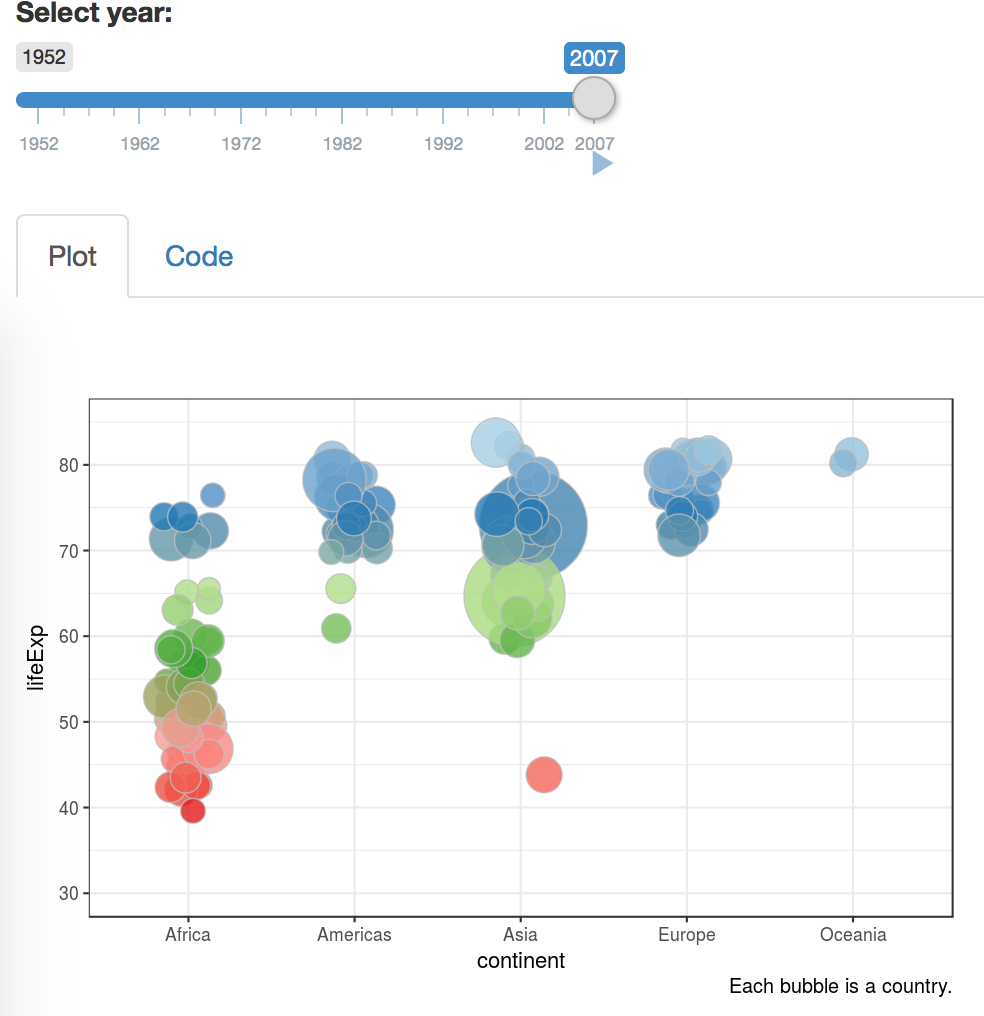
What is Shiny? Shiny is an R package (install.packages("shiny")) for making your outputs interactive. Furthermore, Shiny creates web apps meaning your work can be shared online with people who don’t use R. In other words: with Shiny, R people can make websites without ever learning Javascript etc. I am completely obsessed with Shiny and these days I end up presenting most of my work in a Shiny app. If it’s not worth putting in a Shiny app it’s not worth doing.
Continue reading

To create a .bib file that only includes the citations you used in the manuscript: bibexport -o extracted_file.bib manuscript.aux There are a few issues with this though. The command bibexport comes with the installation of TexLive, but my Windows computer (bless) does not cooperate (“bibexport is not recognised as an internal or external command…") . So I can only use it on my Mac (luv ya).

Continue reading

Get data from ggplot()

ggplot includes built in and seamless functionality that summarises your data before plotting it. As shown in the example below, ggplot_build() can be used to access the summarised dataset. fill y count prop x PANEL group ... #D7301F 0.2147239 35 1 1 1 4 ... #FC8D59 0.6871166 77 1 1 1 3 ... #FDCC8A 0.9570552 44 1 1 1 2 ... #FEF0D9 1.0000000 7 1 1 1 1 ... #D7301F 0.

Continue reading

R: ISO codes and country names

install.packages(‘maps’) iso = maps::iso3166 > str(iso) 'data.frame': 269 obs. of 5 variables: $ a2 : chr "AW" ... $ a3 : chr "ABW" ... $ ISOname : chr "Aruba" .. $ mapname : chr "Aruba" ... $ sovereignty: chr "Netherlands" ...

Continue reading

Author's picture

Riinu Pius (Ots)

if it aint broke, you’re outdated

Senior Data Manager

Edinburgh, UK