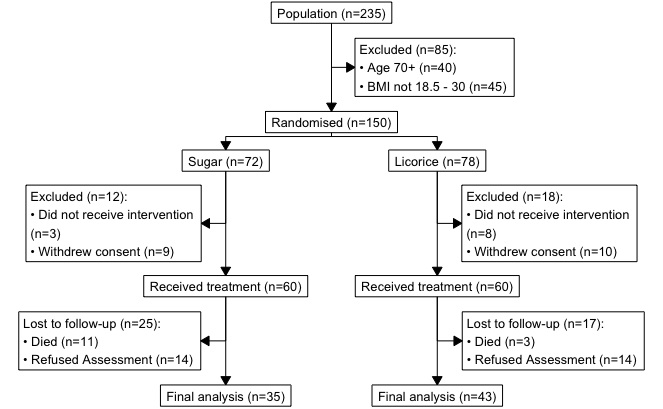
TLDR: library(consort) is a great package for creating CONSORT/patient flow diagrams in R. Thank you author Alim Dayim!
Jump to example code.
Documentation.
Introduction The easiest way to make a one-off diagram is using something with a graphical interface, such as Power Point, Omnigraffle, or Lucidchart, just to name a few.
If, however, you need something that updates automatically based on the underlying dataset changing, then a programmatical solution using R is possible.

