TLDR: You can teach R on people’s own laptops without having them install anything or require an internet connection.
Members of the Surgical Informatics team in Ghana, 2019. More information: surgicalinformatics.org
Introduction Running R programming courses on people’s own laptops is a pain, especially as we use a lot of very useful extensions that actually make learning and using R much easier and more fun. But long installation instructions can be very off-putting for complete beginners, and people can be discouraged to learn programming if installation hurdles invoke their imposter syndrome.
TLDR: there are two new and very intuitive R functions for reshaping data: see Examples of pivot_longer() and pivot_wider() below. At the time of writing, these new functions are extremely fresh and only exist in the development version on GitHub (see Installation), we should probably wait for the tidyverse team to officially release them (in CRAN) before putting them into day-to-day use.
Exciting!
Introduction The juxtapose of data collection vs data analysis: data that was very easy to collect, is probably very hard to analyse, and vice versa.
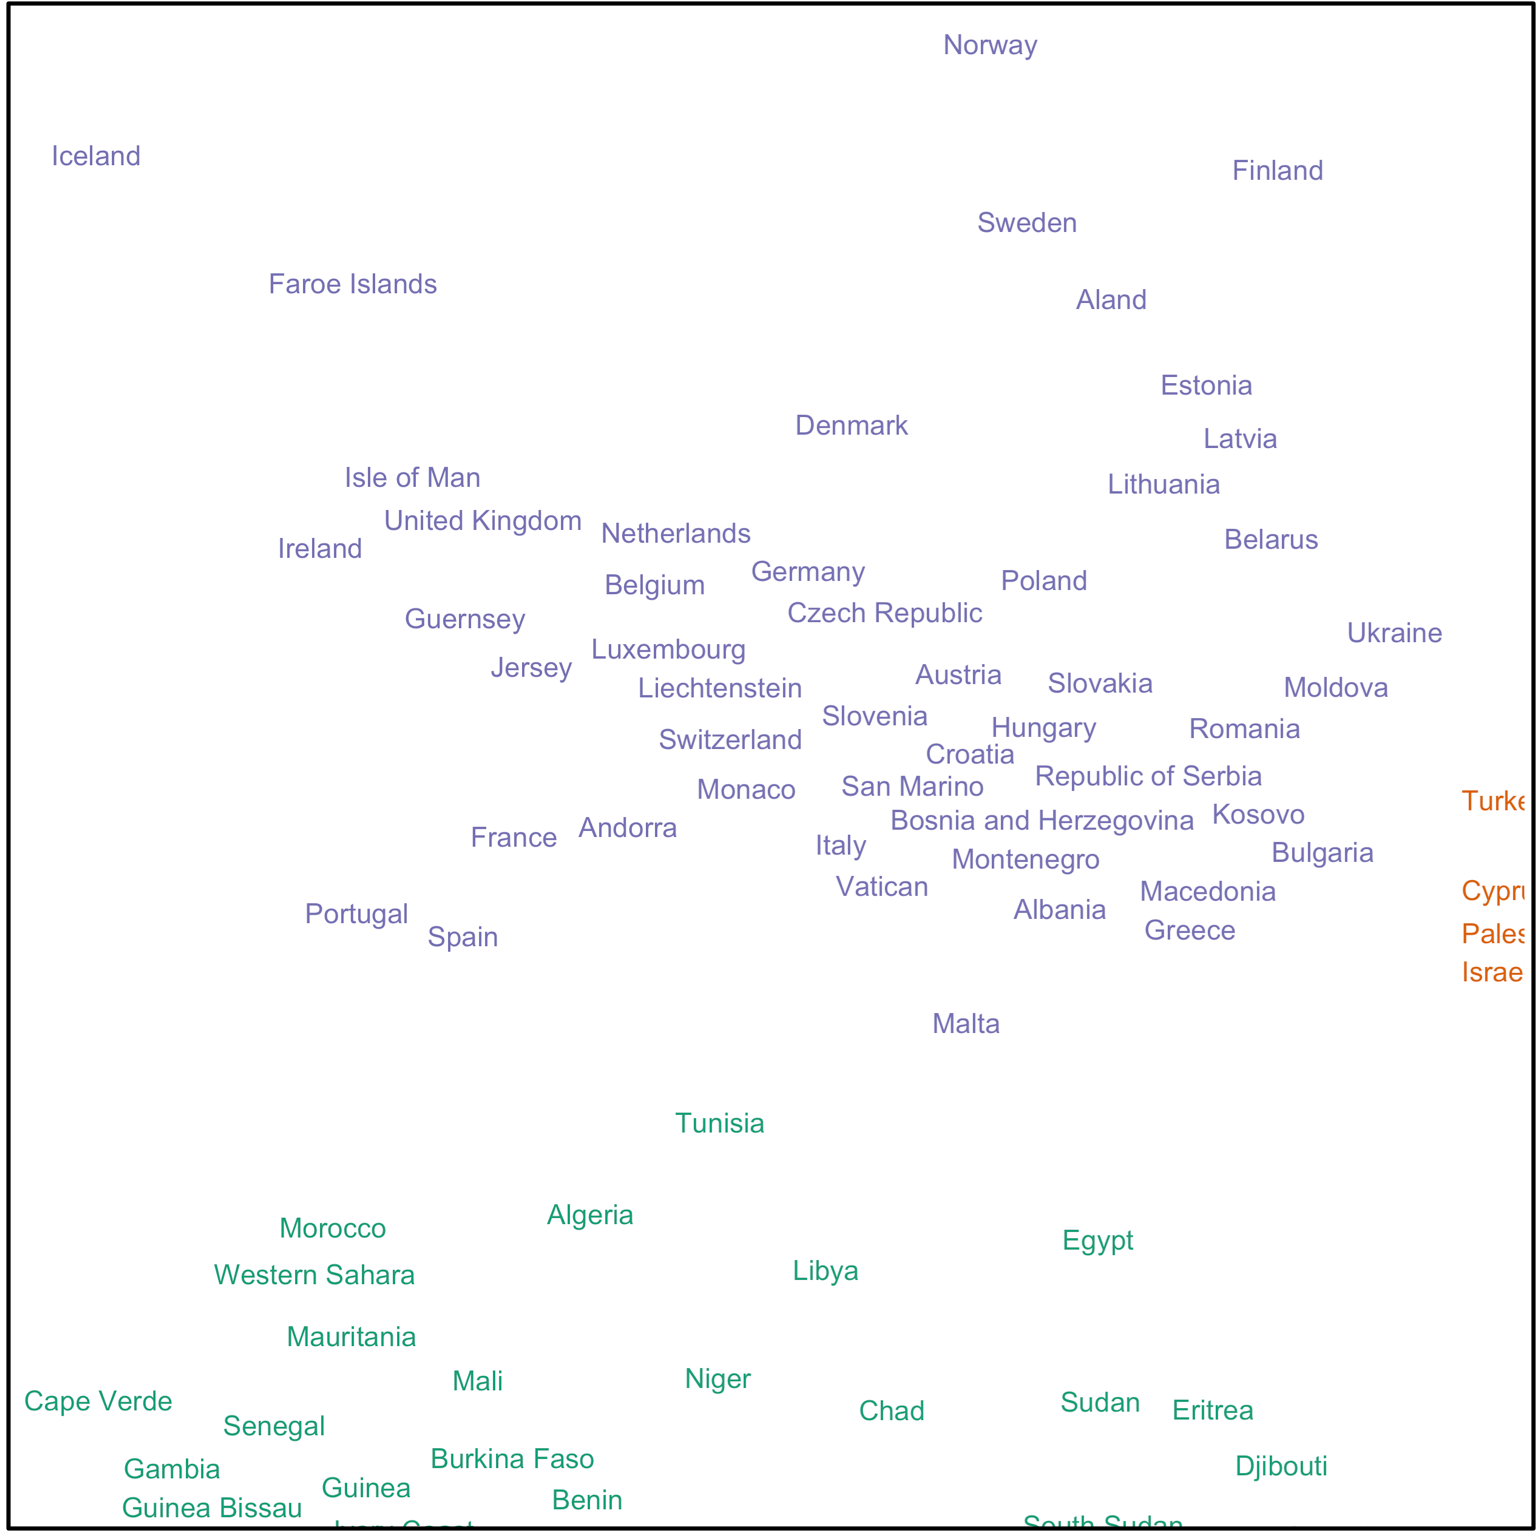
This post demonstrates the use of two very cool R packages - ggrepel and patchwork.
ggrepel deals with overlapping text labels (Code#1 at the bottom of this post):
patchwork is a very convenient new package for combining multiple different plots together (i.e. what we usually to use grid and gridExtra for).
More info:
https://github.com/slowkow/ggrepel
https://github.com/thomasp85/patchwork
To really demonstrate the power of them, let’s make a global map of country names using ggrepel:
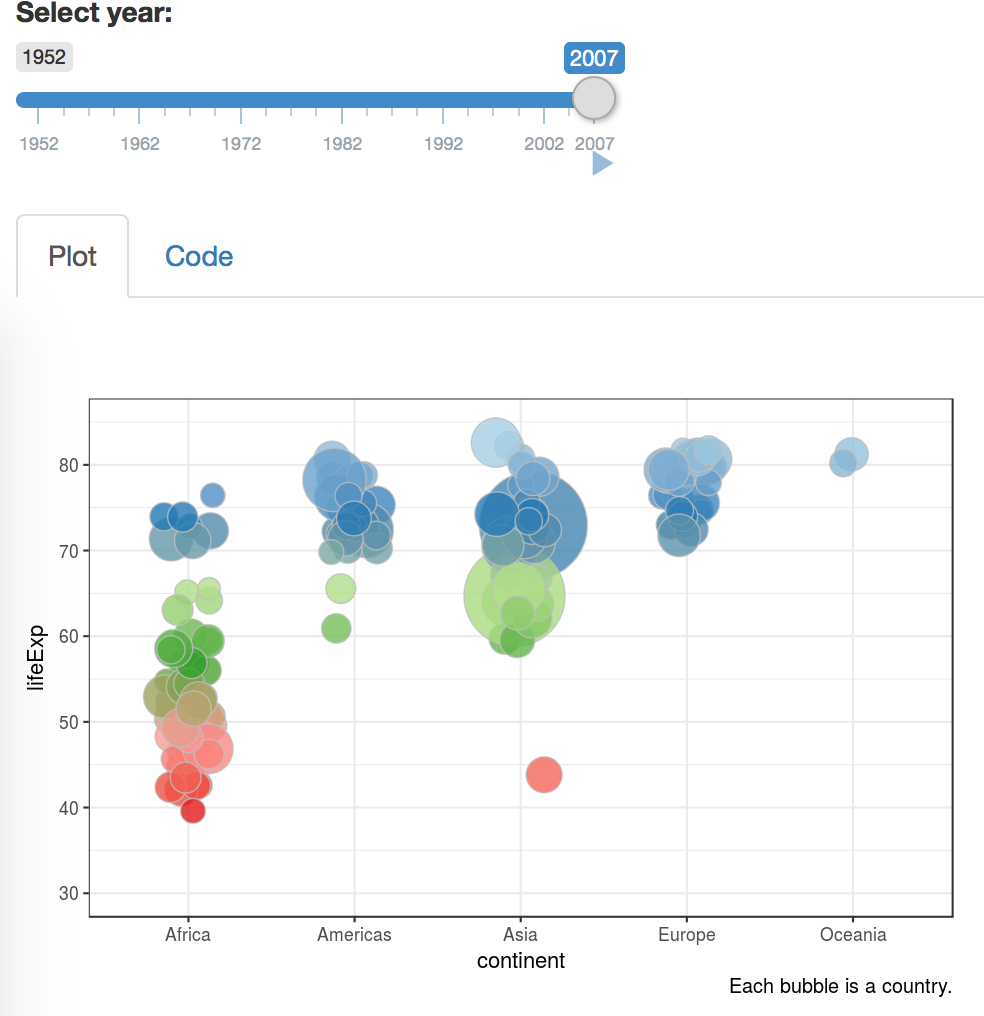
What is Shiny? Shiny is an R package (install.packages("shiny")) for making your outputs interactive. Furthermore, Shiny creates web apps meaning your work can be shared online with people who don’t use R. In other words: with Shiny, R people can make websites without ever learning Javascript etc.
I am completely obsessed with Shiny and these days I end up presenting most of my work in a Shiny app.
If it’s not worth putting in a Shiny app it’s not worth doing.
With a simple combination of mutate_if and fct_explicit_na, you can replace all NAs in all factors with “Missing”:
dplyr reference: http://dplyr.tidyverse.org/reference
forcats reference: http://dplyr.tidyverse.org/reference

ggplot includes built in and seamless functionality that summarises your data before plotting it. As shown in the example below, ggplot_build() can be used to access the summarised dataset.
fill y count prop x PANEL group ... #D7301F 0.2147239 35 1 1 1 4 ... #FC8D59 0.6871166 77 1 1 1 3 ... #FDCC8A 0.9570552 44 1 1 1 2 ... #FEF0D9 1.0000000 7 1 1 1 1 ... #D7301F 0.